This is trade #4 in the AI-assisted series, bought a few minutes before the US close on 2 November, the same session that Applied Materials stopped out. Written before the result is known. The ticker, the price, the stop and the target levels were Claude’s. The size was mine.
Trade summary
| Action | Bought |
| Ticker | AMZN, NASDAQ, USD |
| Quantity | 5 shares |
| Fill price | USD 246.00 (limit 246.00, Day) |
| Cost | USD 1,230.00, commission 1.09 |
| Executed | 3 Nov 2026, 04:54 SGT (2 Nov, 15:54 ET) |
| Stop order | USD 223.50, GTC, attached to the buy ticket (working) |
| Profit levels | None set. Claude’s reference levels: 266 and 278. The exit is my decision. |
| Decision point | 1 Dec 2026 |
| Status | Open |
Why I am doing this
Amazon fell 5.6% over the two sessions around its third-quarter results: 4.2% on 29 October and 1.4% more on 30 October, when 58 million shares traded, nearly three times normal. The quarter itself was fine. What the market disliked was the spending. I wanted a large, liquid name that had already had its bad days, with earnings behind it, and that was not another chip stock. Three trades in, two of my buys were semiconductors and both ended at the stop.
What I believed before the trade
- The correction from the August high was three months old, not three days old.
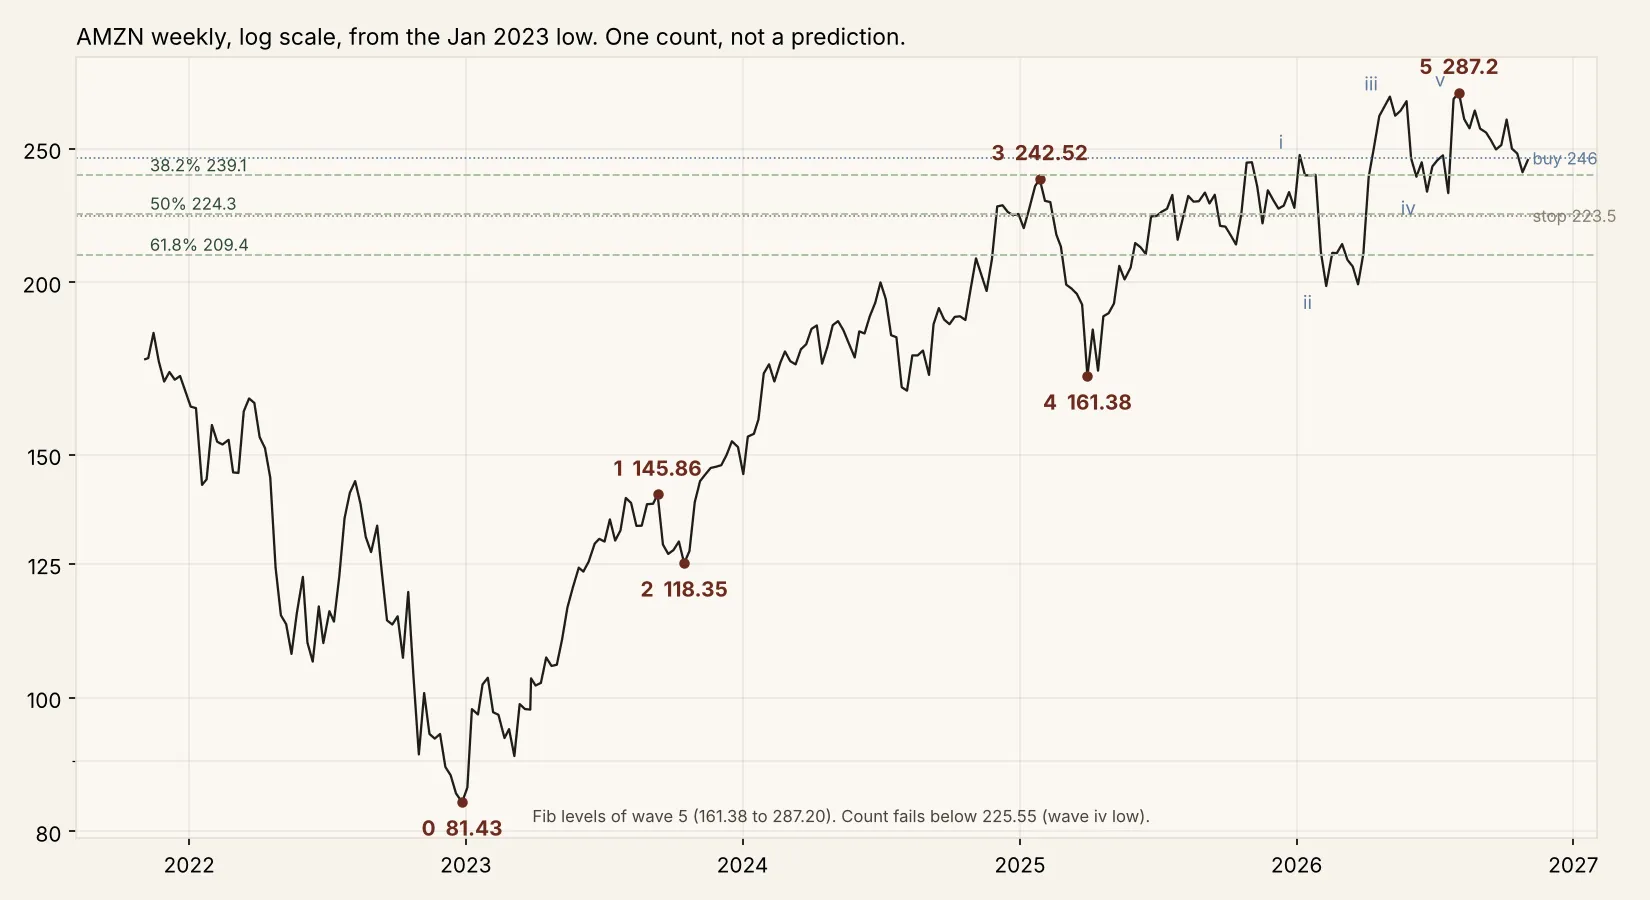
- The stock was sitting on a Fibonacci level, the 38.2% retracement of the last leg up at 239.
- With earnings out of the way, a bounce back towards the October range (250 to 265) was the base case.
- If I was wrong, the floor at 224 to 226 (the July low, the June wave low, the 50% Fibonacci) would tell me quickly.
The evidence available at the time
The case for
- 29 Oct 2026, Q3 results: revenue USD 201.9B, up 12%; AWS USD 46B, up 39%; Q4 guide USD 240B to 247B.
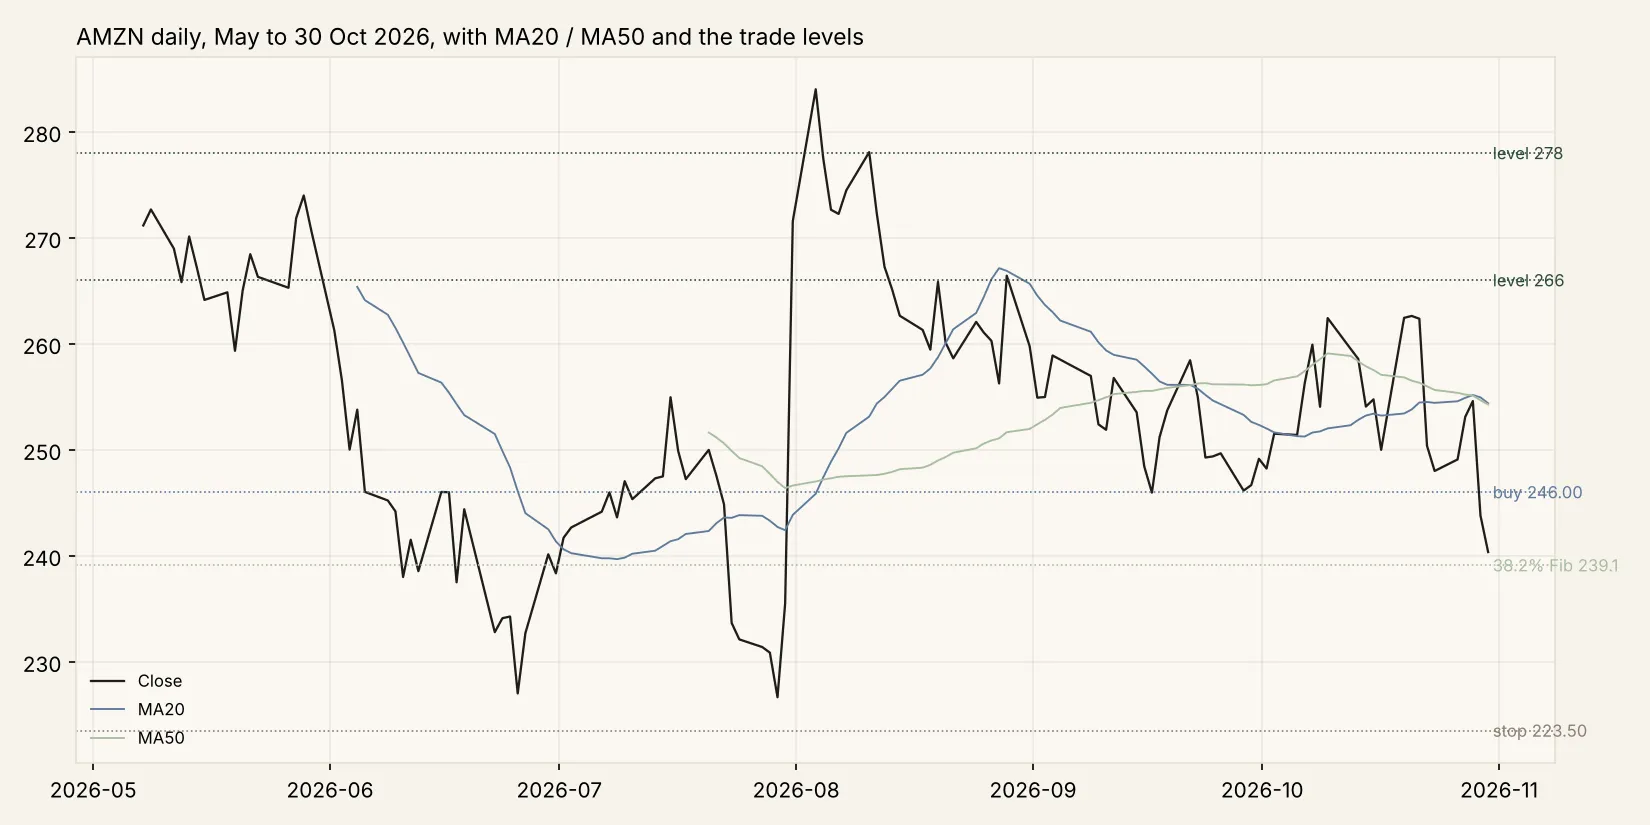
- 30 Oct 2026: the stock closed at 240.35, 1.25 above the 38.2% Fibonacci level at 239.1, on 58.5M shares.
- 2 Nov 2026, session open: 243.01, up from the 240.35 close; it traded to 253.81 during the day.
- RSI 14 at 38.3 on the 30 Oct close: pulled back, not broken.
The case against
- 30 Oct 2026: trailing twelve-month free cash flow was negative USD 42.4B, with 2026 capital spending guided to about USD 220B. The drop was about spending, and that does not change in a month.
- 30 Oct 2026: price closed below both the 20-day (254.39) and the 50-day (254.28) averages. A fourth bounce buy below both averages, after the first three went one for three.
- The entry trigger (a close above the 30 Oct high of 241.55) had not printed when I bought; the buy was minutes before the close that would decide it.
- The weekly count reads the August high as the end of a five-wave rise. If that is right, this is a bounce inside a bigger correction, not a new leg up.
Basic TA at entry
AMZN, as of the 30 Oct 2026 close, from IBKR daily bars.
| Indicator | Value | Read |
|---|---|---|
| Price | 240.35 | Below both moving averages |
| MA20 | 254.39 | Price 5.5% below; MA20 flat (251.64 twenty sessions earlier) |
| MA50 | 254.28 | Price 5.5% below; the two averages have met |
| RSI 14 | 38.3 | Weak, not oversold |
| Trend | Sideways to down | Lower highs since the 287.20 top in August; range 229 to 265 since September |
| Support | 229.36 (30 Oct low) | 4.6% below price; wider floor 224 to 226 |
| Resistance | 254.4 (MA20, 28 Oct close 254.60) | 5.8% above price |
| Volume | 58.5M vs 21.9M 20-day average | 2.7 times normal on the earnings drop |
| Trigger | No | Bought before the 2 Nov close; the trigger level was 241.55 |
Overall read: an oversold large cap on a Fibonacci level, bought before the trend had turned. The stop sits under the whole floor, which is why it is wide.
Claude
Claude ranked Amazon first on its watch list on 2 November. Green on a trigger close above 241.55, five shares, limit near the open, no chase above 246. Before a trigger, half size: two shares, amber, logged against the rule. Stop 223.50 GTC under the 224 to 226 floor. Alert at 266 (about plus 10% from the 30 October close, the October highs) and a second at 278 (the May high, two to one against the wider stop). Decision point 1 December. When the stock ran up 4% in the first half hour on 2 November, Claude’s offer was a resting limit at 246 for two shares, not a chase.
Me
I took the resting limit at 246 for two shares at 23:07. When the Applied Materials stop fired at 03:26 and freed the cash, I raised the order to five. AMAT was sold, so I wanted to put more on Amazon. My rule, not Claude’s suggestion. I left the stop at 223.50 on purpose, 9% below the fill, wider than my own two-to-one rule, because I want the trade to survive a retest of the floor rather than be shaken out at 235.
I want the trade to survive a retest of the floor rather than be shaken out at 235.
How it was executed
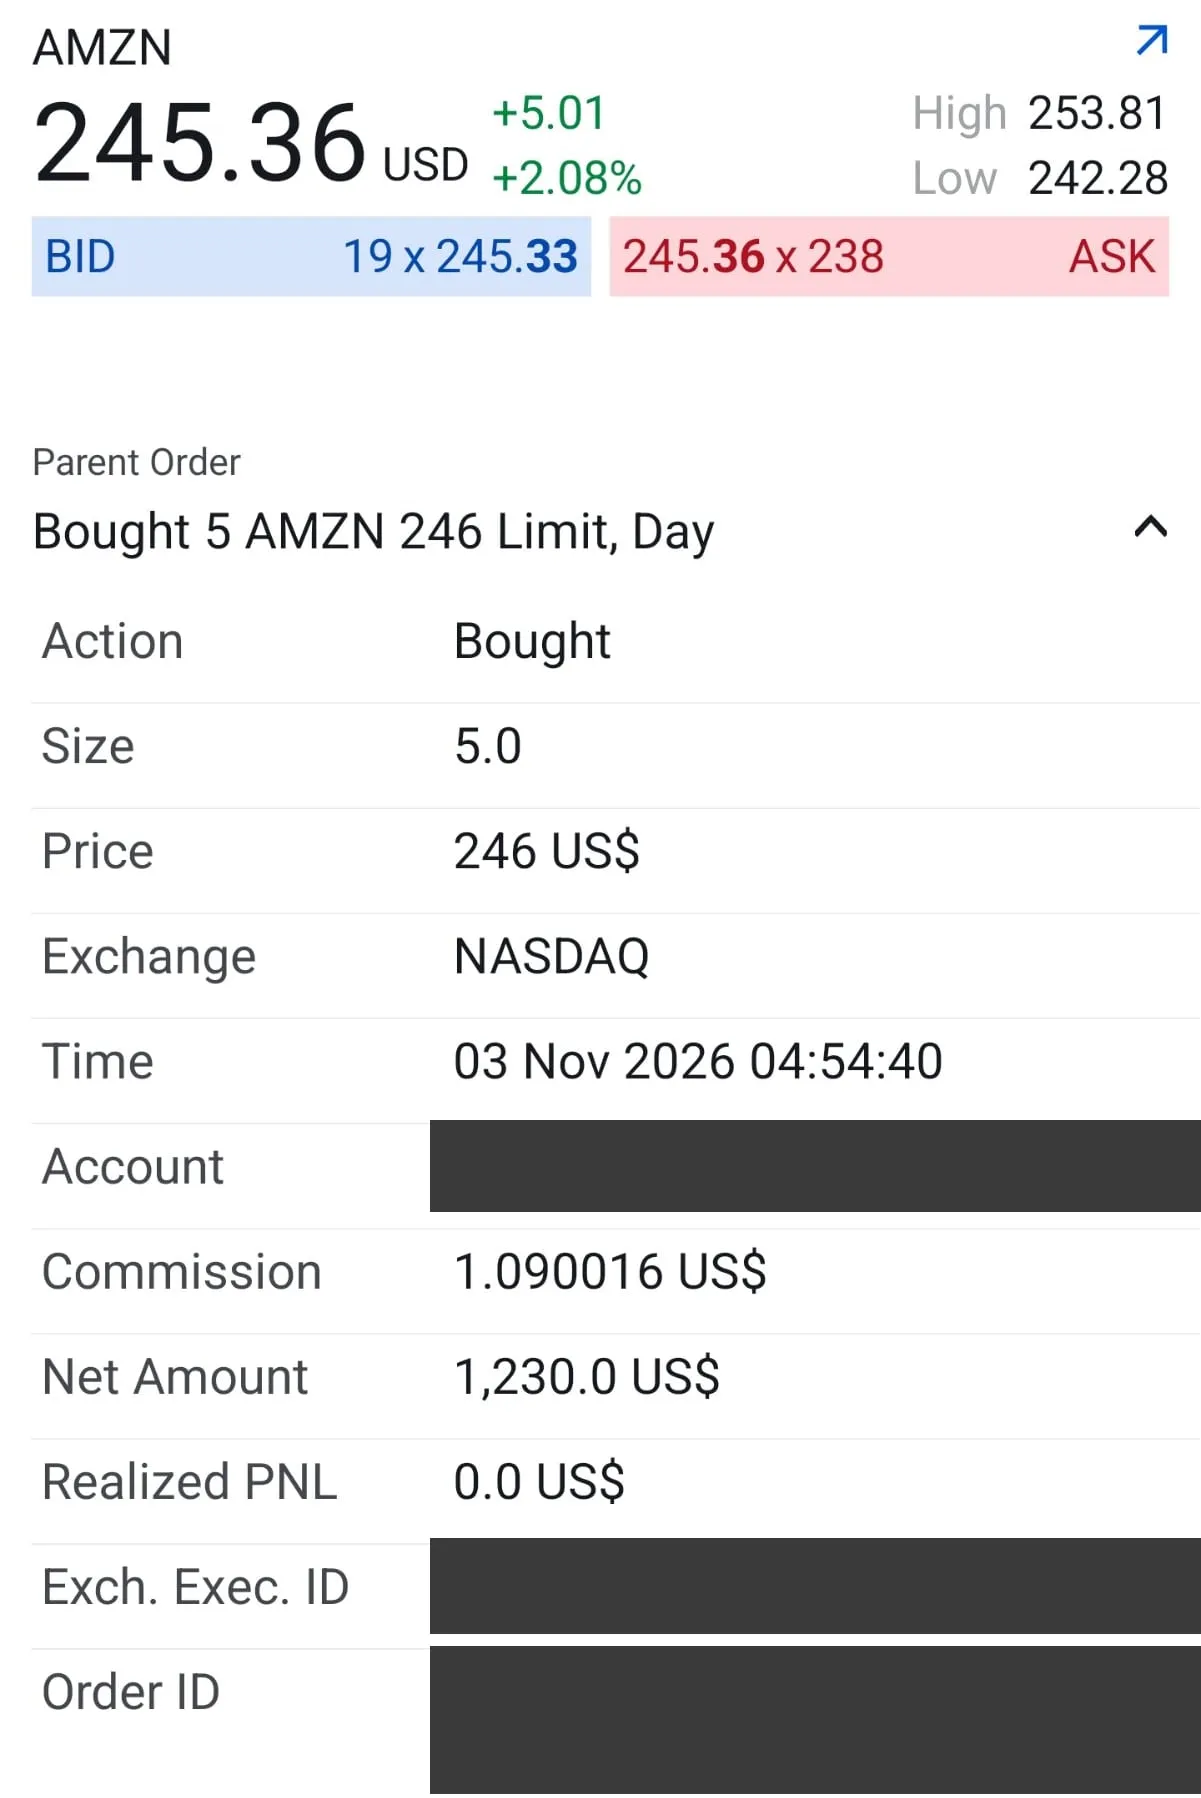
Resting limit placed at 23:07 SGT on 2 November through the IBKR connector and approved in the app, with the stop attached on the ticket. Raised from two to five shares at 03:38 SGT; IBKR moved the attached stop to five shares with it. Filled at 04:54:40 SGT, six minutes before the close, at 246.00 on NASDAQ. Stop 223.50 GTC confirmed under Open Orders. No price alerts set; I decided I don’t need them.
What would make this wrong
- A close below 225.55. The wave count fails there, and the stop at 223.50 sits just under it; I would be out at about minus 9%.
- The 30 October low at 229.36 giving way on volume before any bounce. That would say the spending worry is not done.
- A drift sideways to the 1 December decision point without touching 266. Dead money is a cost too.
- Being the fourth bounce buy below both averages, after two of the first three hit the stop.
What happened next
Dated follow-ups go here. Nothing above this line gets edited.
3 Nov 2026. The 2 November session closed at 245.63, above the 241.55 trigger. So the trigger fired that night, about six minutes after my buy, which went in before the close that decided it. Range for the day: 242.28 to 253.81.
4 Nov 2026. Closed on 4 Nov 2026, see Amazon, closed by hand at 270.
Sources
- IBKR Trades and Orders, 3 Nov 2026 04:55 SGT (fill, commission, stop).
- IBKR daily and weekly bars, AMZN, to 2 Nov 2026 (moving averages, RSI, Fibonacci levels, wave count, computed and drawn in code).
- Constellation Research, 29 Oct 2026, AWS Q3 revenue growth surges 39% (quarter numbers, cash flow, capex guide).
- Frost and Prechter, Elliott Wave Principle, for the counting method.
Updates to this post
| Date | What changed |
|---|---|
| Closing-line link text updated to the exit post's new title | |
| Closing line added, trade closed at target |
This is a record of one small trade in my own account, written to learn from. It is not advice. Claude is an AI tool, not a financial adviser, and neither am I.